PointView® features and data types
Services
PointView® is a complete platform for handling, visualizing and digitizing point cloud data. Read more about the powerful tools here.
Fixed geometric dimensions in PointView®
PointView® has all the tools you need for recording coordinates to 3D point, vertical and horizontal distance measurement, recording areas and measuring volumes.
Fixed geometric dimensions in PointView®
PointView® has all the tools you need for recording coordinates to 3D point, vertical and horizontal distance measurement, recording areas and measuring volumes.
Intuitive user interface
PointView® is easy and straightforward to use. Log in, select data and start working with it. Completely without downloading programs or plugins.
Visualization of point clouds
There are a variety of options for choosing how to visualize the point cloud. If the metadata of the point cloud allows, it can be easily displayed with, for example, elevation, intensity or with RGB colors.
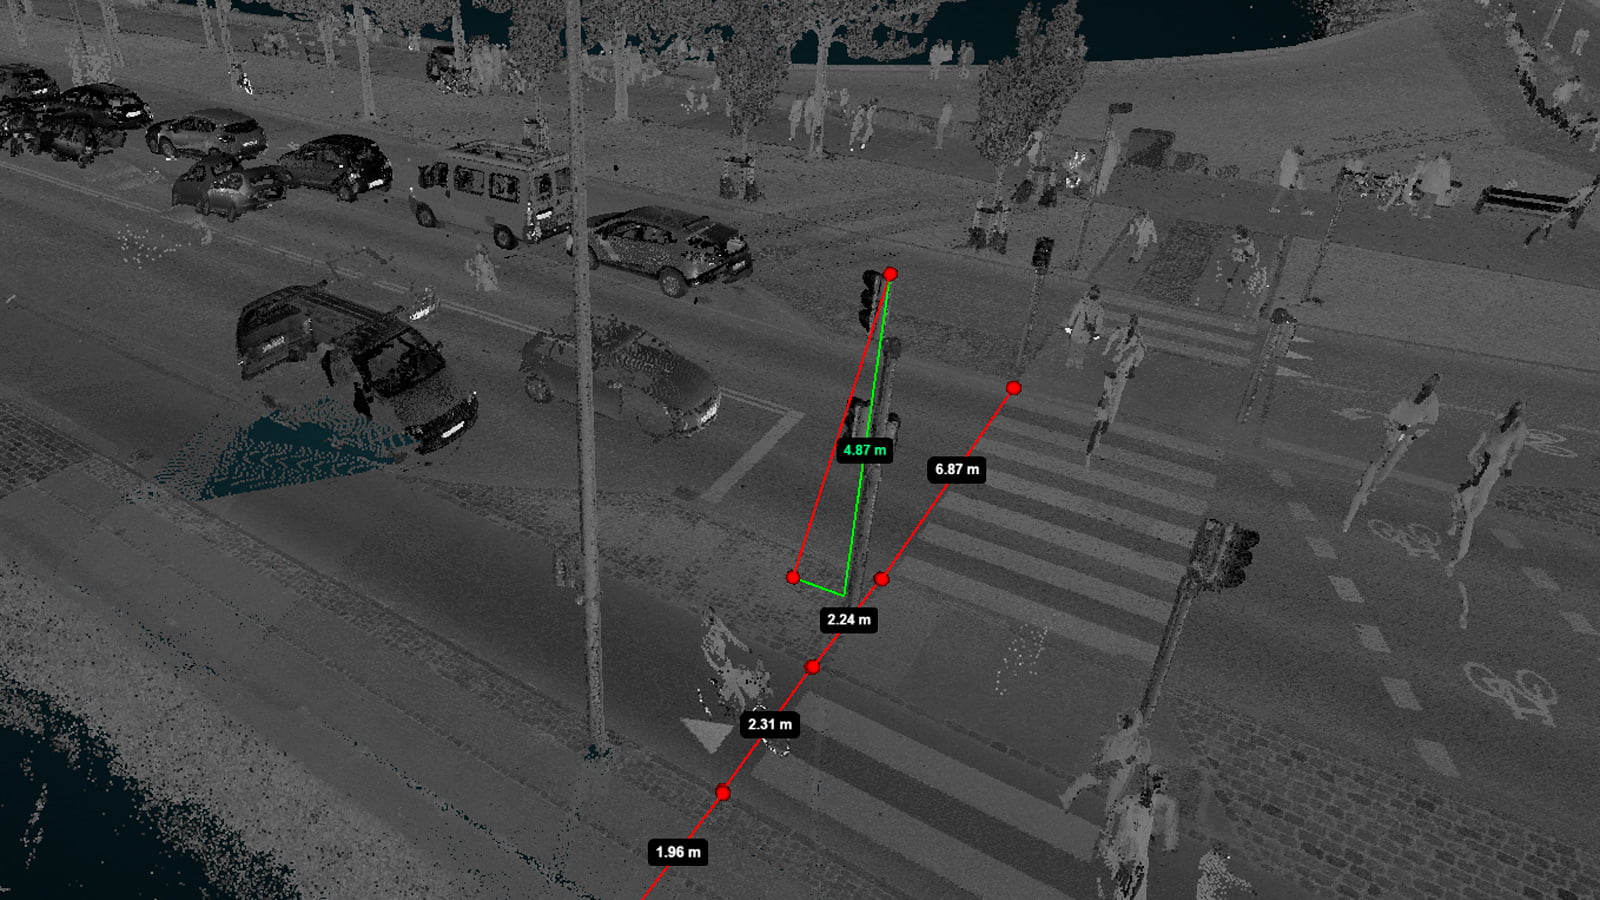
Measurements, 2D and 3D
PointView® has all the tools you need for recording coordinates to 3D point, vertical and horizontal distance measurement, recording areas and measuring volumes.
Digitization
All the digitization tools you need are available. Create point, vector and polygon registration directly in PointView®.
Cross sections
Easy tool for identifying and displaying cross sections in the point cloud. The cross section can also be downloaded very easily.
Direct export of data
Select any area in the point cloud, export to LAS and download a smaller data set that can be used in other applications.
Integration to CAD
Direct integration to existing CAD software packages. Digitization directly to Bentley Software is supported at present – more to come.
Integration to GIS
PointView® enables direct integration to your own GIS via WFS / WMS.
Upload data
Complete web interface for uploading custom data sets directly for viewing in PointView®.
Scaling, positioning and rotation of video based point clouds
Depending on your data type, point clouds can be georeferenced to fit the desired coordinate system.
Compile and compare multiple point clouds in layers
PointView® allows multiple point clouds being displayed simultaneously. This means that a point cloud of older date can be compared with a newer point cloud to follow and document progress in a construction situation.
Adapted to all known coordinate systems
PointView® supports all known coordinate systems with a valid ESPG code.
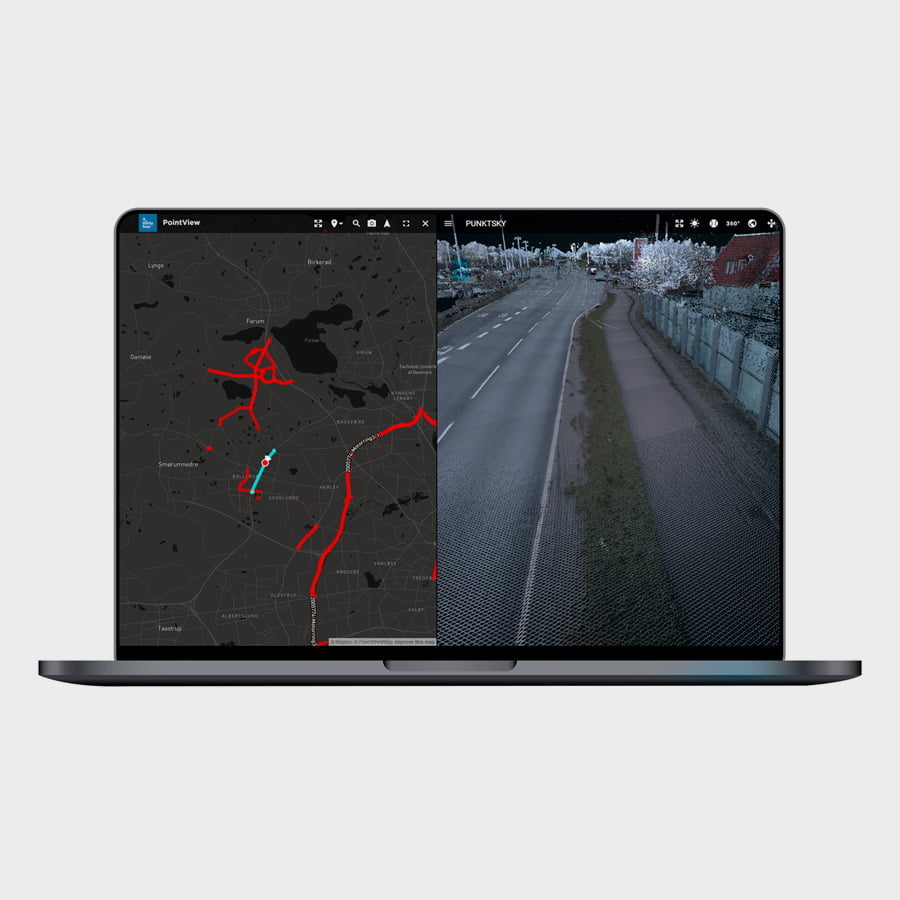
Versatile data options
PointView® can handle a wide range of data types and exhibits images and point clouds in an intuitive split screen solution. The data options are many:
• Offshore surveying via multibeam scanning, where you can, for example, visualize and measure on bridge piers, the seabed, or a channel in a harbor entrance.
• Drone surveying via photogrammetry, where, for example, a terrain model can be made that can help estimate digging work and planning conditions.
• SLAM data via laser scanning, where, for example, a building is measured with indication of building elements, staircases and facade elements can be extracted as objects. This will typically take place in connection with renovation and documentation of existing conditions.
• Mobile Mapping via laser scanner and 360-degree camera, where railways, airports, tunnels, bridges and infrastructure are most often measured. Here, for example, can be visualized and measured on the extent of ballast profile, rails, sleepers and edge fences.
• Terrestrial laser scanning, which is a highly detailed survey of, for example, building parts, structures and warehouses, industrial halls.
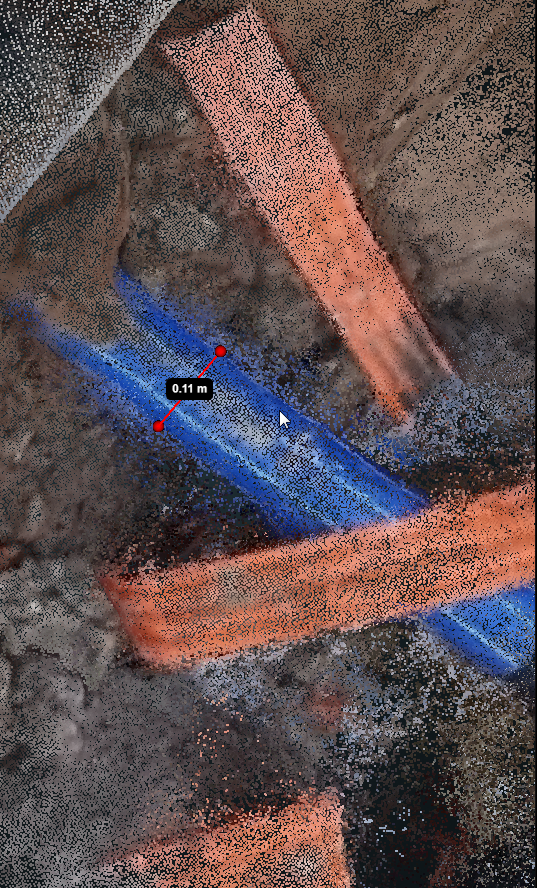
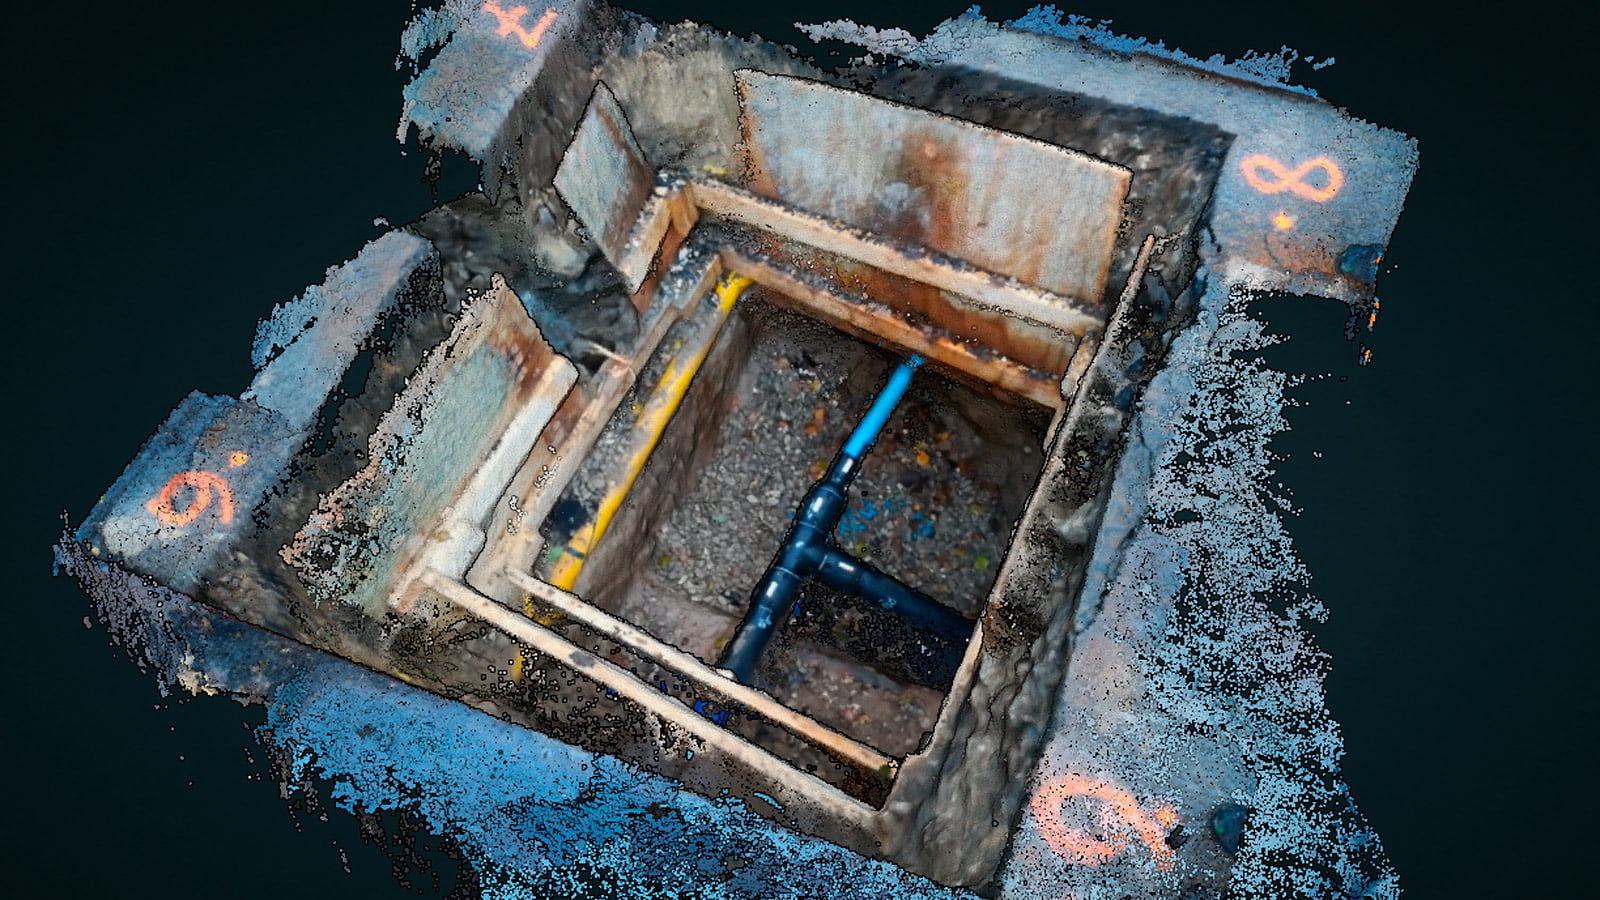
• SmartSurvey data from our own app for the mobile phone can be used to advantage as a starting point for extracting and digitizing, for example, water pipes or wells from an excavation.
• 3D images from, for example, Mobile Mapping.
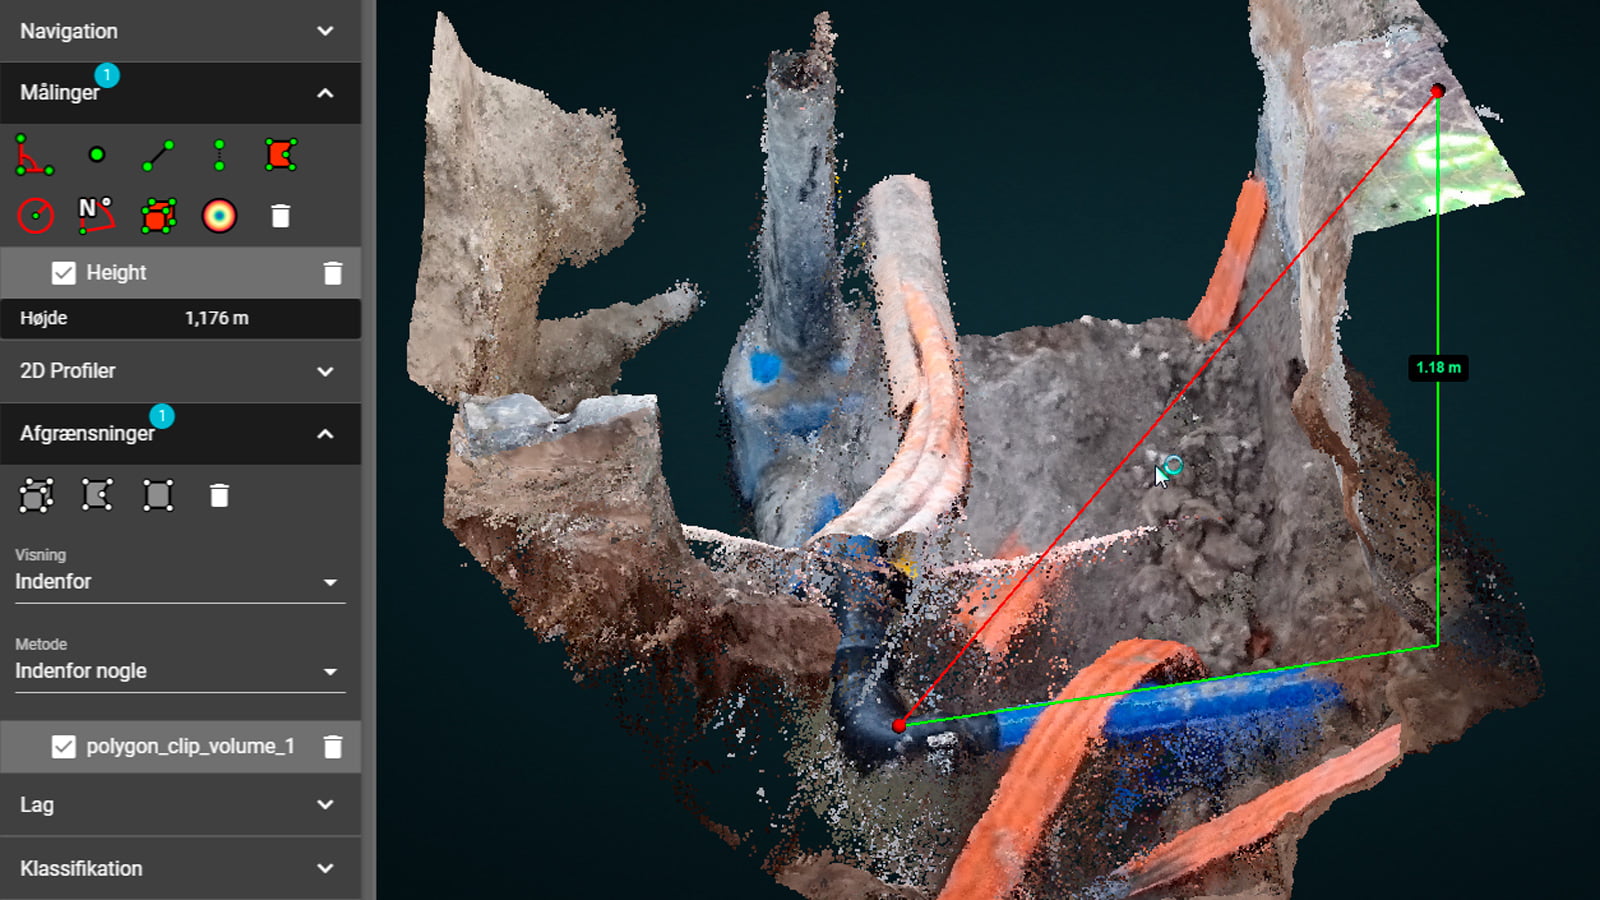
Data from SmartSurvey™
Below an example of point cloud data from SmartSurvey™ and to the right is an example of the data management that can be done from the screen with PointView®.
Data from SmartSurvey™
Below an example of point cloud data from SmartSurvey™ and to the right is an example of the data management that can be done from the screen with PointView®.
Get started today
IT IS EASY TO GET STARTED
PointView® makes it easy to carry out all kinds of measuring, registration and documentation directly from your screen. Navigate seamlessly through 3D mapping data, overview maps, panoramic images and point clouds. It is user-friendly, intuitive and cost-effective.
Go to PointView® and create a user and you are ready to upload your data. You are also welcome to play with our demo data, accessible in PointView® directly from the map view.
Why choose an IT34 solution?
EVERYTHING IN ONE PLACE
We have united IT infrastructure, development and consulting in one place. This allows us to develop tailor-made software, advise on the best IT setup and provide ongoing support. Independently of each other or in an overall solution.
UNIQUE EXPERTISE IN GEODATA
Our professional set-up includes some of the world's leading experts in geographic data, register data and GIS data. We are with you from first idea to finished solution.
INNOVATION IS OUR DNA
Our developers are shaped by the Scandinavian approach to innovation, design and user experience. We believe in simple solutions to complex problems.